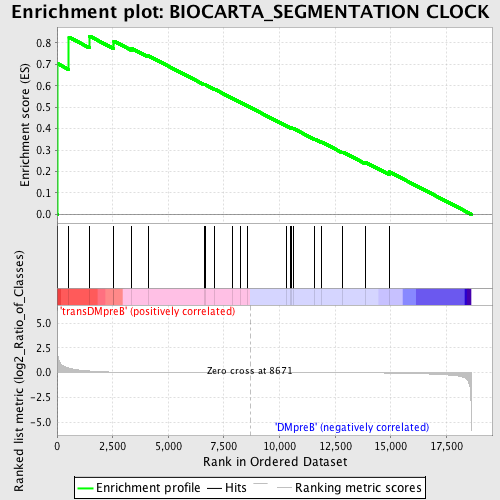
Profile of the Running ES Score & Positions of GeneSet Members on the Rank Ordered List
| Dataset | Set_04_transDMpreB_versus_DMpreB.phenotype_transDMpreB_versus_DMpreB.cls #transDMpreB_versus_DMpreB.phenotype_transDMpreB_versus_DMpreB.cls #transDMpreB_versus_DMpreB_repos |
| Phenotype | phenotype_transDMpreB_versus_DMpreB.cls#transDMpreB_versus_DMpreB_repos |
| Upregulated in class | transDMpreB |
| GeneSet | BIOCARTA_SEGMENTATION CLOCK |
| Enrichment Score (ES) | 0.8319148 |
| Normalized Enrichment Score (NES) | 1.5551076 |
| Nominal p-value | 0.007677543 |
| FDR q-value | 0.6090337 |
| FWER p-Value | 0.959 |
| PROBE | DESCRIPTION (from dataset) | GENE SYMBOL | GENE_TITLE | RANK IN GENE LIST | RANK METRIC SCORE | RUNNING ES | CORE ENRICHMENT | |
|---|---|---|---|---|---|---|---|---|
| 1 | AXIN1 | 1579 23330 | 18 | 2.123 | 0.7033 | Yes | ||
| 2 | HES1 | 22798 | 533 | 0.455 | 0.8266 | Yes | ||
| 3 | ADAM17 | 4343 | 1456 | 0.165 | 0.8319 | Yes | ||
| 4 | DVL1 | 2412 15960 | 2550 | 0.053 | 0.7907 | No | ||
| 5 | LRP6 | 9286 | 2551 | 0.053 | 0.8082 | No | ||
| 6 | WNT1 | 22371 | 3341 | 0.028 | 0.7751 | No | ||
| 7 | NKD2 | 7798 | 4099 | 0.017 | 0.7400 | No | ||
| 8 | DKK1 | 23700 | 6625 | 0.005 | 0.6057 | No | ||
| 9 | HEY2 | 19794 | 6654 | 0.004 | 0.6057 | No | ||
| 10 | PSEN1 | 5297 2125 9630 | 7081 | 0.003 | 0.5839 | No | ||
| 11 | NKD1 | 8228 | 7868 | 0.002 | 0.5422 | No | ||
| 12 | FZD1 | 16923 | 8227 | 0.001 | 0.5232 | No | ||
| 13 | DKK2 | 15418 | 8555 | 0.000 | 0.5057 | No | ||
| 14 | HES7 | 20828 | 10316 | -0.004 | 0.4123 | No | ||
| 15 | LFNG | 4991 | 10512 | -0.004 | 0.4032 | No | ||
| 16 | CSNK2A1 | 14797 | 10540 | -0.004 | 0.4031 | No | ||
| 17 | RBPJ | 9709 3594 5370 | 10628 | -0.004 | 0.3999 | No | ||
| 18 | PROC | 23475 | 11587 | -0.007 | 0.3508 | No | ||
| 19 | DLL1 | 23119 | 11884 | -0.008 | 0.3376 | No | ||
| 20 | KREMEN2 | 23104 | 12838 | -0.013 | 0.2905 | No | ||
| 21 | WIF1 | 19866 | 13853 | -0.021 | 0.2430 | No | ||
| 22 | GSK3B | 22761 | 14935 | -0.040 | 0.1980 | No |

